
You are here
Tutiorial
MagnoliidsGDB is an integrated multifunctional genomics database, collects genomic, transcriptomic and metabolomic from 22 published species and 2 unpublished species (Piper longum, Magnolia sinica), and provides convenient tools for users to search and analyse.
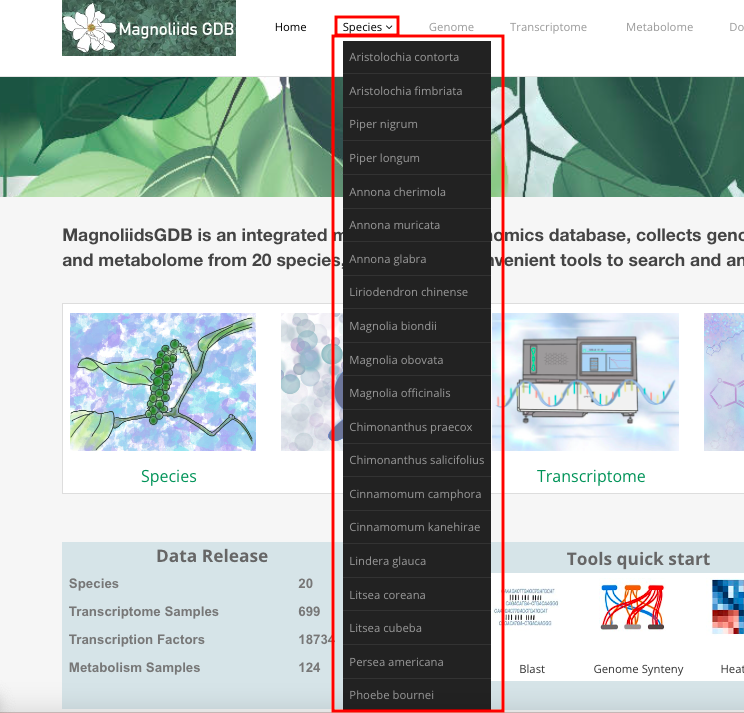
2 Top navigation bar
The top navigation menu gathers general functions of the database, including links to different modules.

3 Five main modules
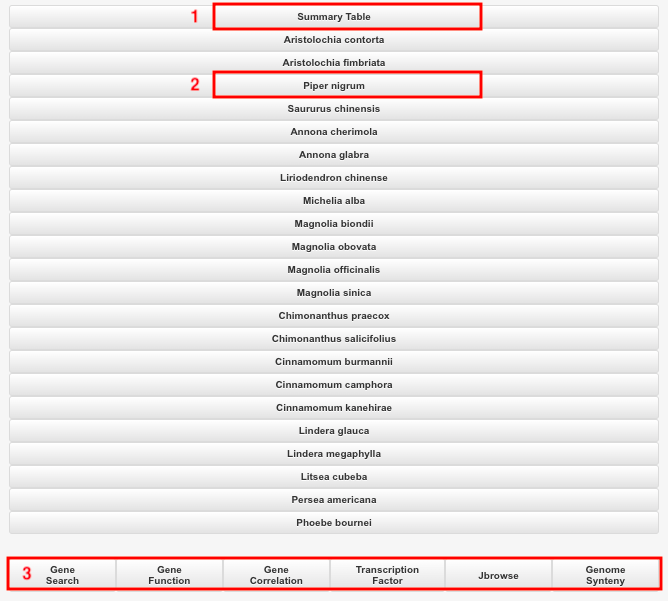
These five main modules refer to Species, Genome, Transcriptome, Metabolome and Variation. Taking the Species module as an example.
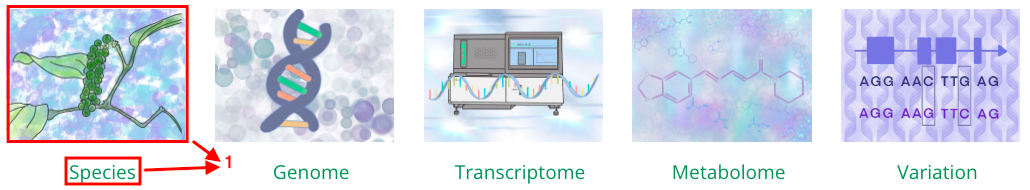
Part 1: Clicking on the image or text will directly navigate to the overall species information page.
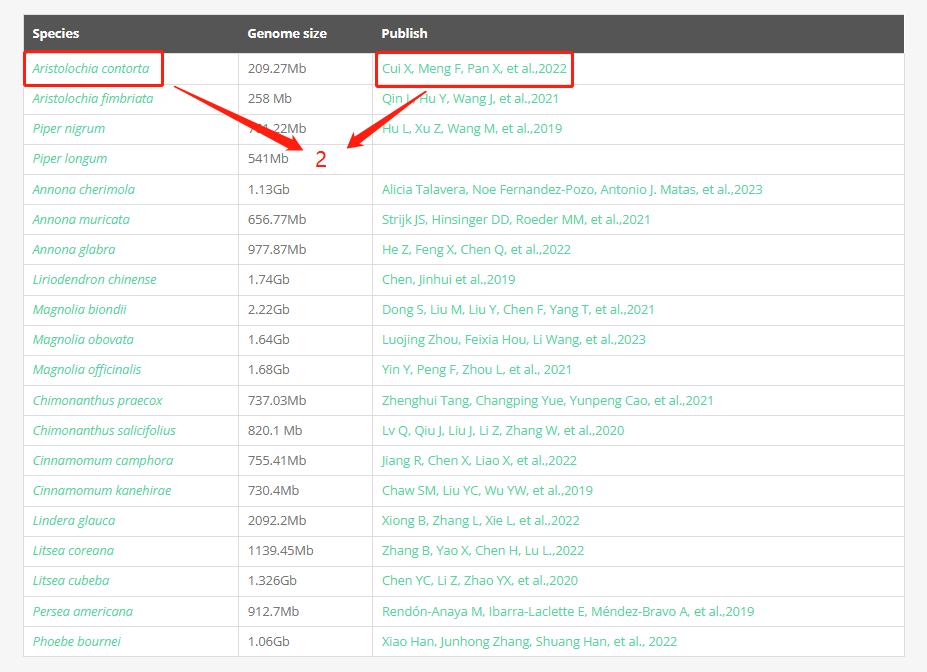
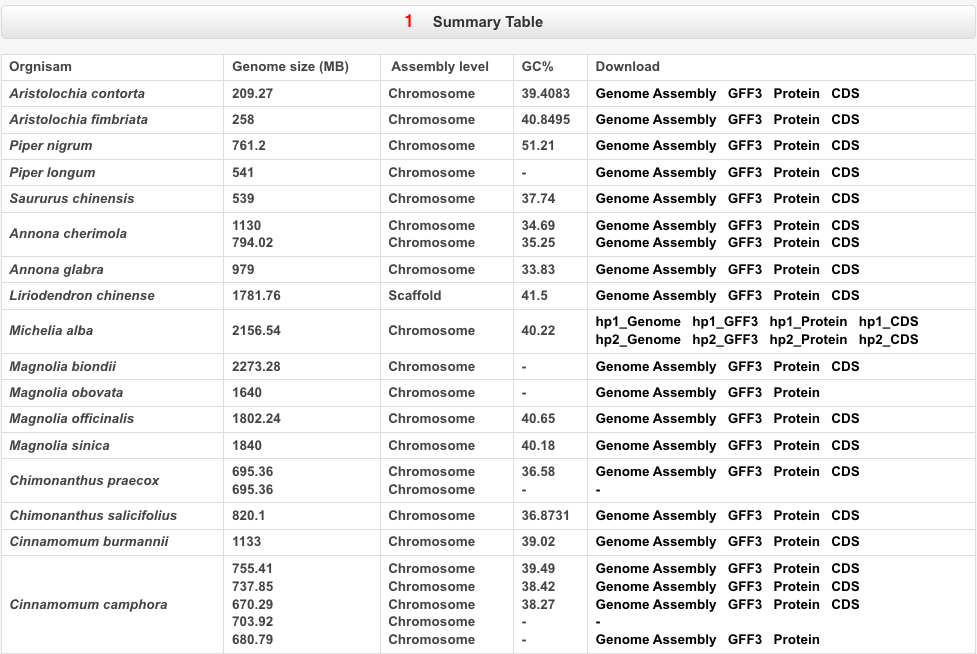
Part 2: This is the overall species information table, where you can find the genome assembly size of each species and related article links. Clicking on a species of interest will navigate to the specific species information page, while clicking on an article link will directly lead to the respective article page.
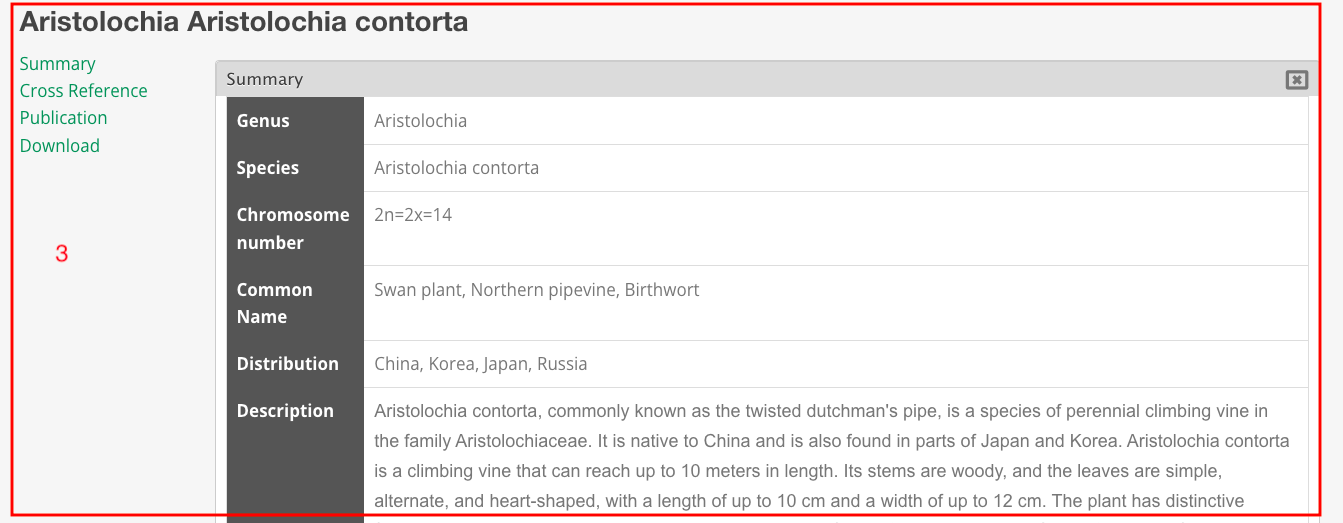
Part 3: This is the species introduction page, which includes basic information about the species, images, cross-references, publications, and download links.
Part 1: Summary table.
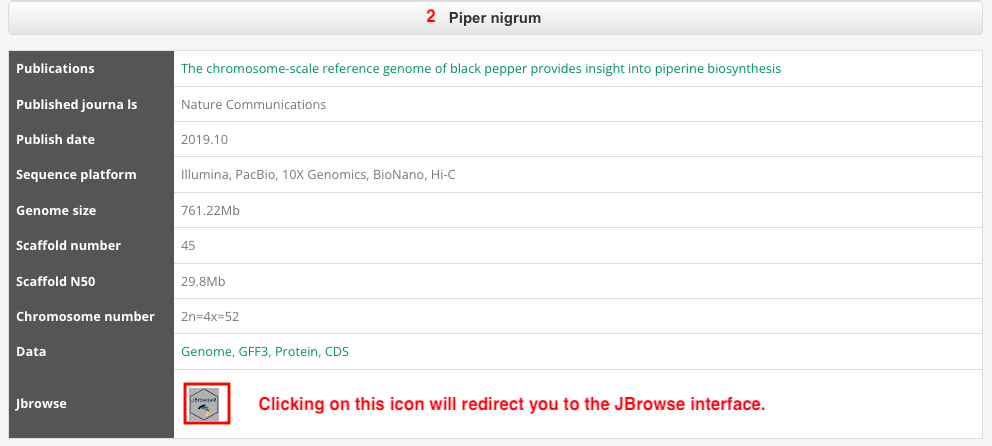
Part 2: The genome information includes Jbrowse, Published journals, Publish date, Sequence method, Assembly method, Genome size, Genome coverage, Scaffold number, Scaffold N50, Contig number, Contig N50, Chromosome number, Data, and Reference URL. Users can access this information by clicking on the dropdown menu.
Part 3: Quick links to genome-related tools.
1 Heatmap
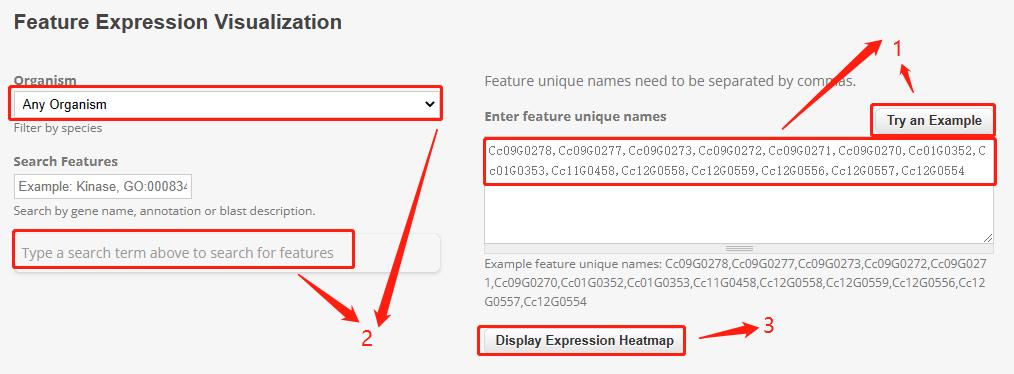
Part 1: Users can directly click on "try an example" to obtain gene IDs.
Part 2: Users can select the species they are interested in, and the dropdown menu will automatically display the gene IDs of the selected species.
Part 3: After selecting the gene ID, clicking on "Display Expression Heatmap" will show the corresponding heat map.
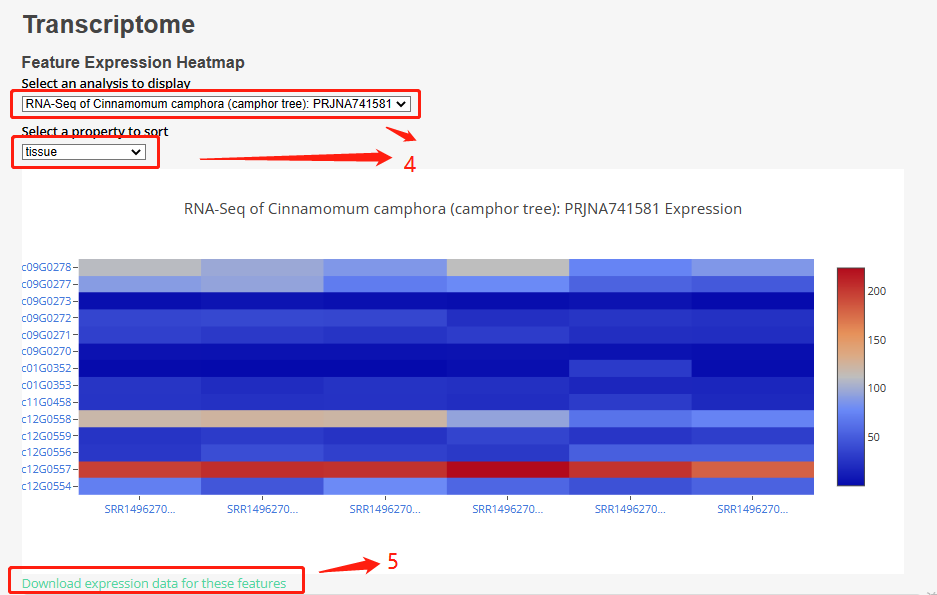
Part 4: By clicking on the dropdown menu, users can select different bioprojects and sorting attributes, which will result in changes to the heat map. Users can also hover their mouse over the heat map to view specific information for each sample.
Part 5: Users can click on the download button to download the expression data of their selected gene in the chosen bioproject.
2 Sample Information and Gene Expression Data Download.
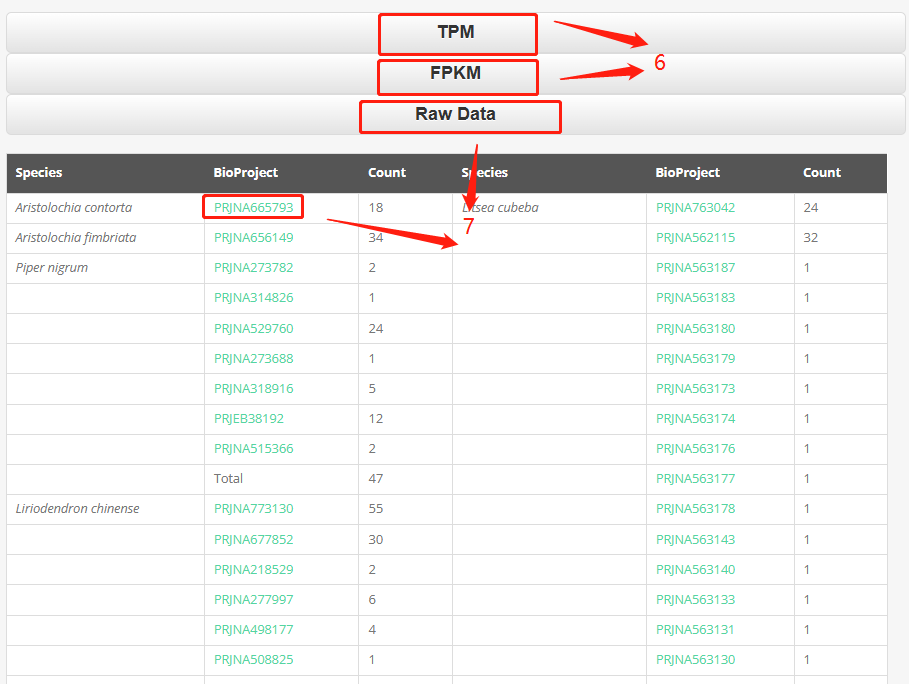
Part 6: We provide TPM data and FPKM data for each species. You can download the expression data of the selected species by clicking on the dropdown menu.
Part 7: By clicking on "Raw Data," you can view the data overview of the species we have processed. Clicking on the project ID will directly navigate to the project information page.
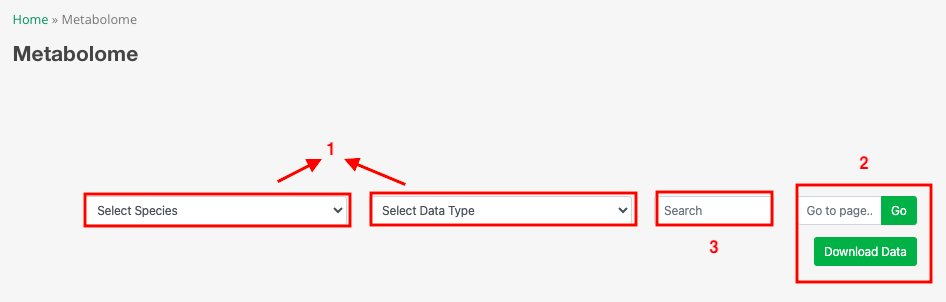
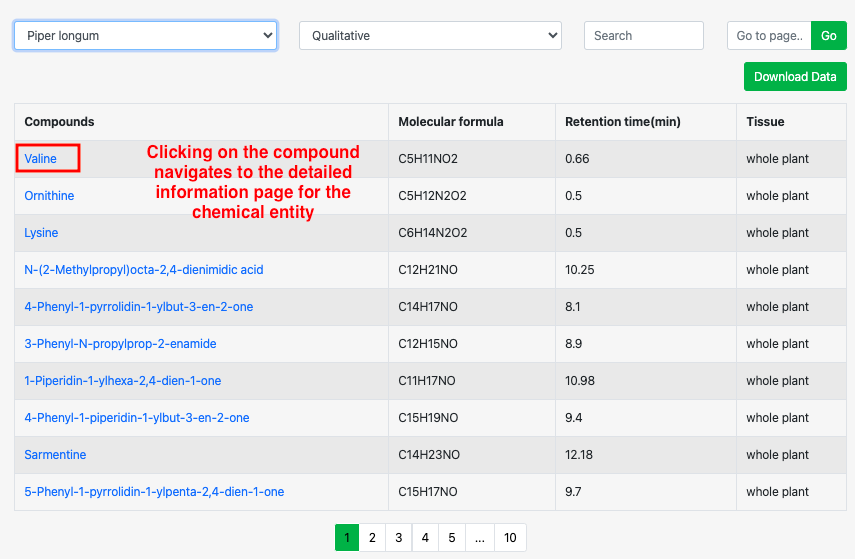
Part 1: Users have the option to select specific species and data types (qualitative and quantitative).
Part 2: Users can enter a page number and click 'Go' to navigate to the specified page. Additionally, users can click 'Download' to download the current table.
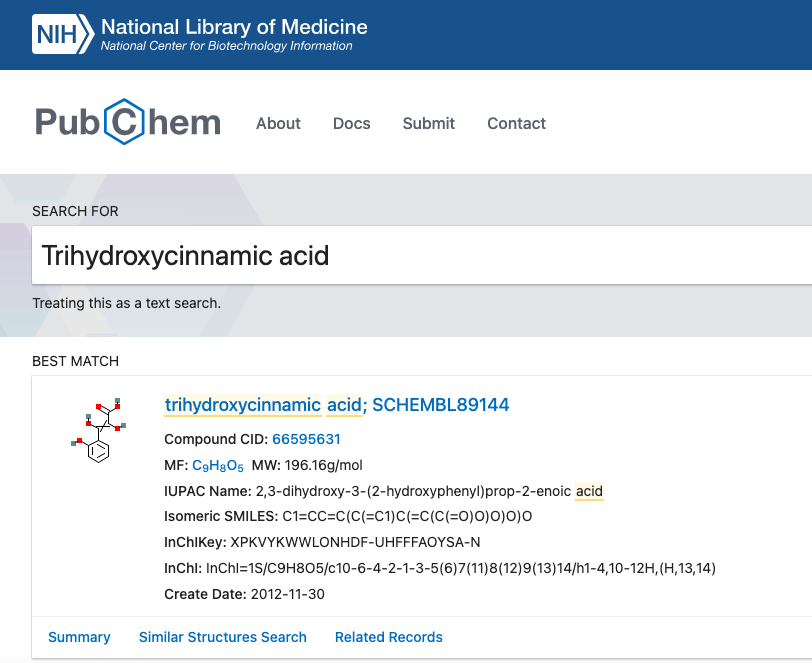
Part 3: Users can enter compounds, molecular formula, retention time (min), and tissue of interest in the box to search for matching metabolites.

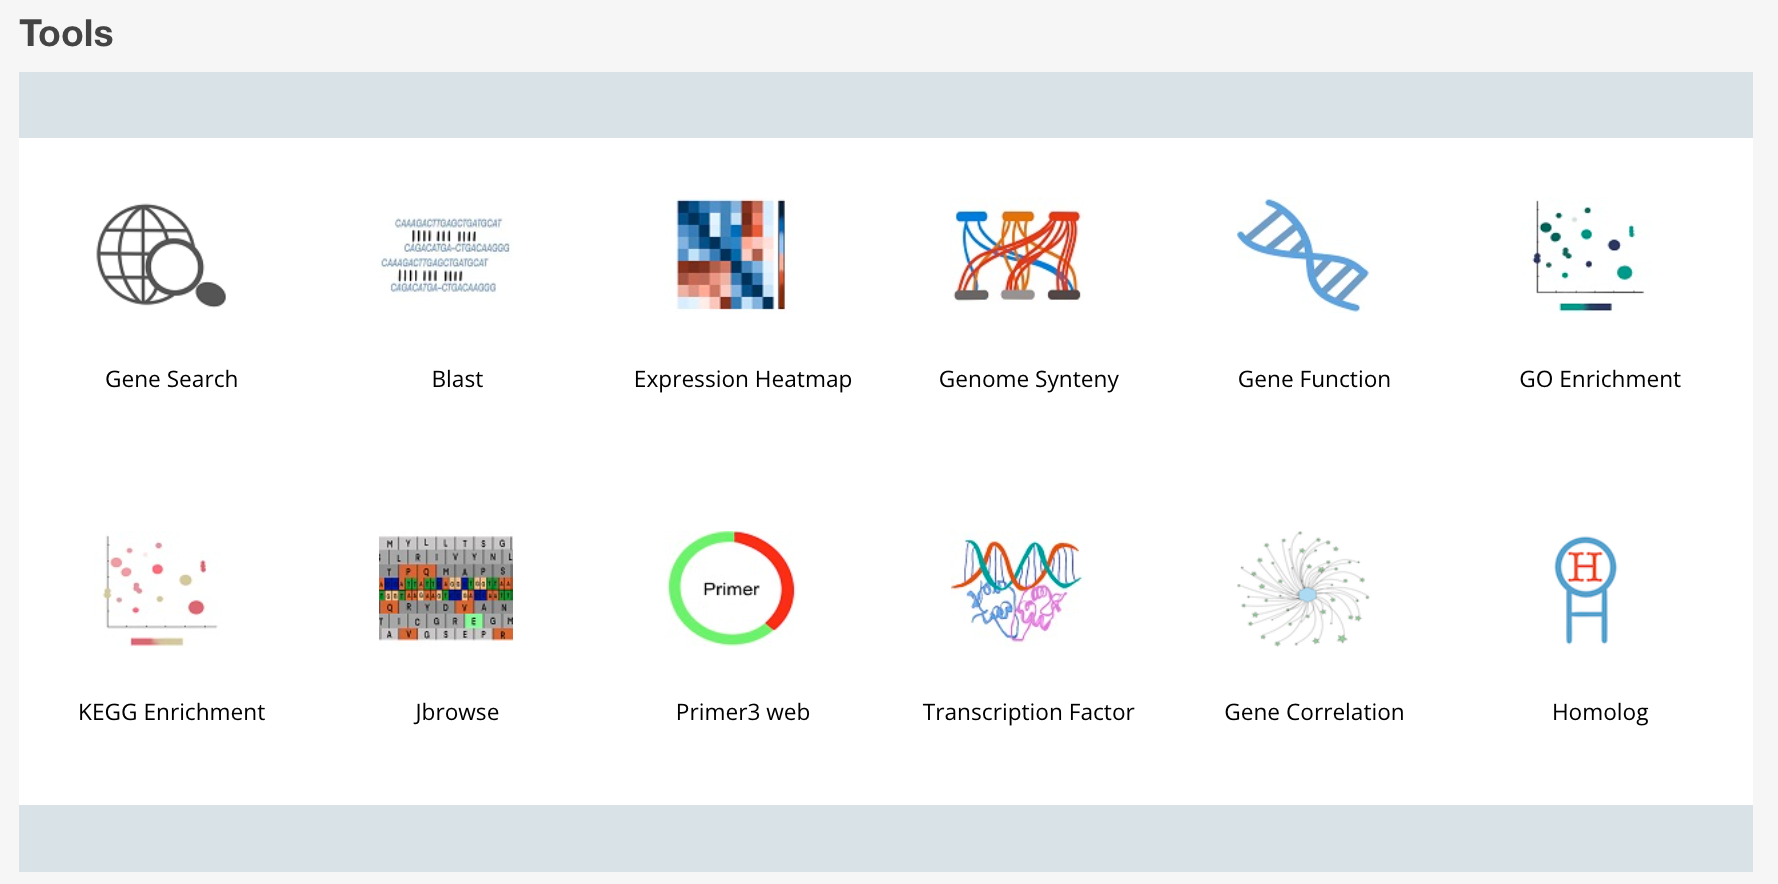
1 Gene Search
Search for sequences by entering names in the field below. Alternatively, you may upload a file of names. You may also filter results by sequence type and the sequence source. To select multiple options click while holding the "ctrl" key. The results can be downloaded in FASTA or CSV tabular format.
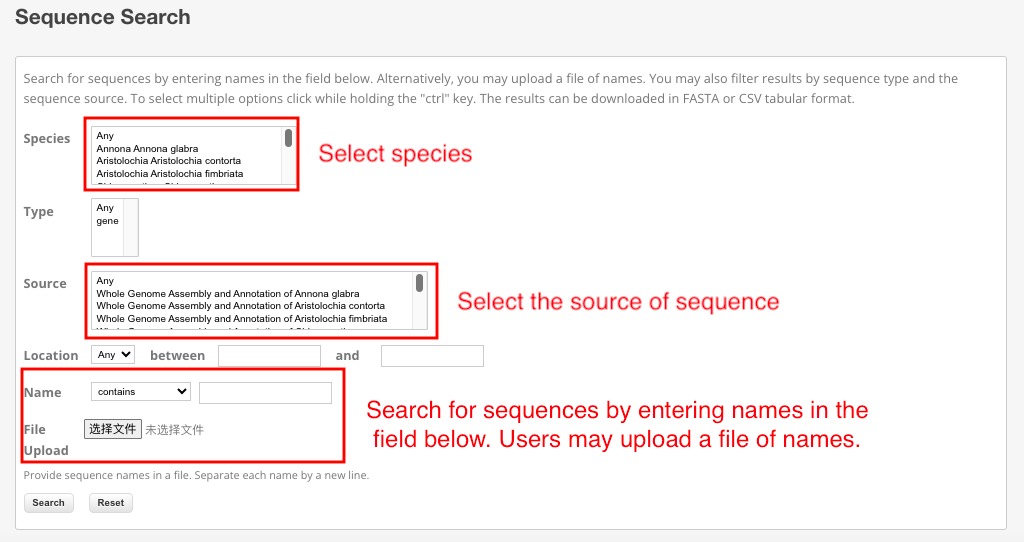
Part 1: Taking "Piper nigrum" as an example, when selecting "Piper nigrum" as the species and choosing 'any' as the source, a direct search will display all sequences related to "Piper nigrum". Upon clicking on any specific sequence, the interface will redirect to the detailed page for that sequence.

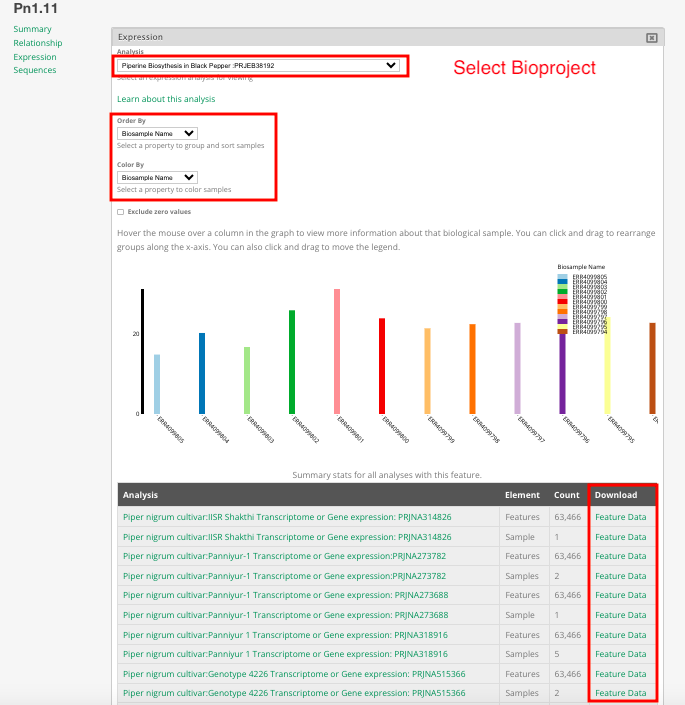
On this page, users can view specific details about the sequence. By selecting the Bioproject, they can observe the expression patterns of the sequence across different biosamples. Additionally, by clicking the download button, users can obtain a downloadable version of the sequence.
2 Gene Function
When users input a gene that exists in this database into the search box and click on 'search' the corresponding functionality of that gene will be displayed.

3 Transcription Factor
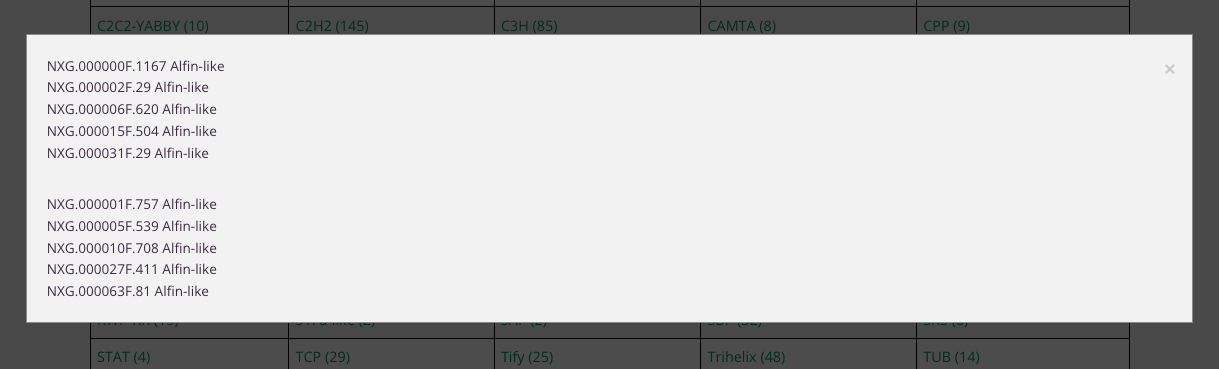
Transcription Factors page provides all the transcription factors predicted in the species. Users can click on transcription factors to jump to the detailed page.
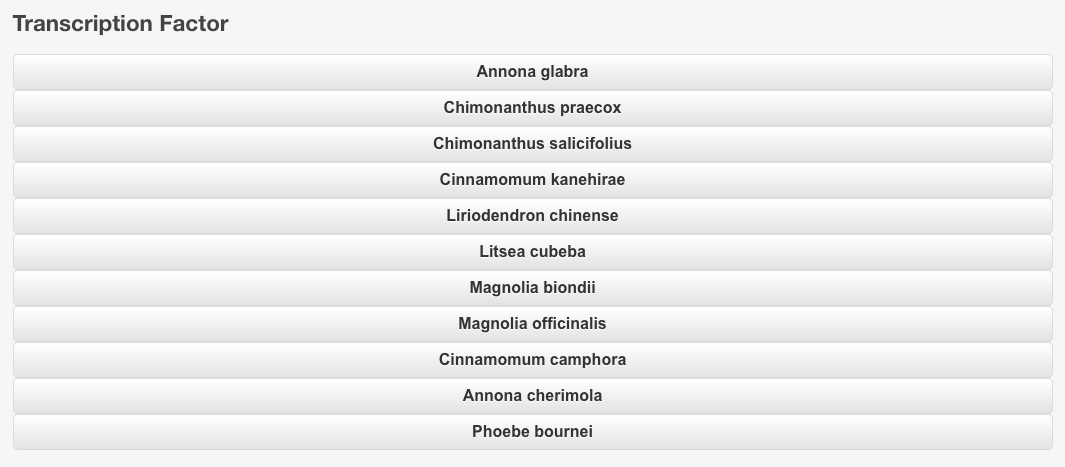
Part 1: Overview of transcription factors
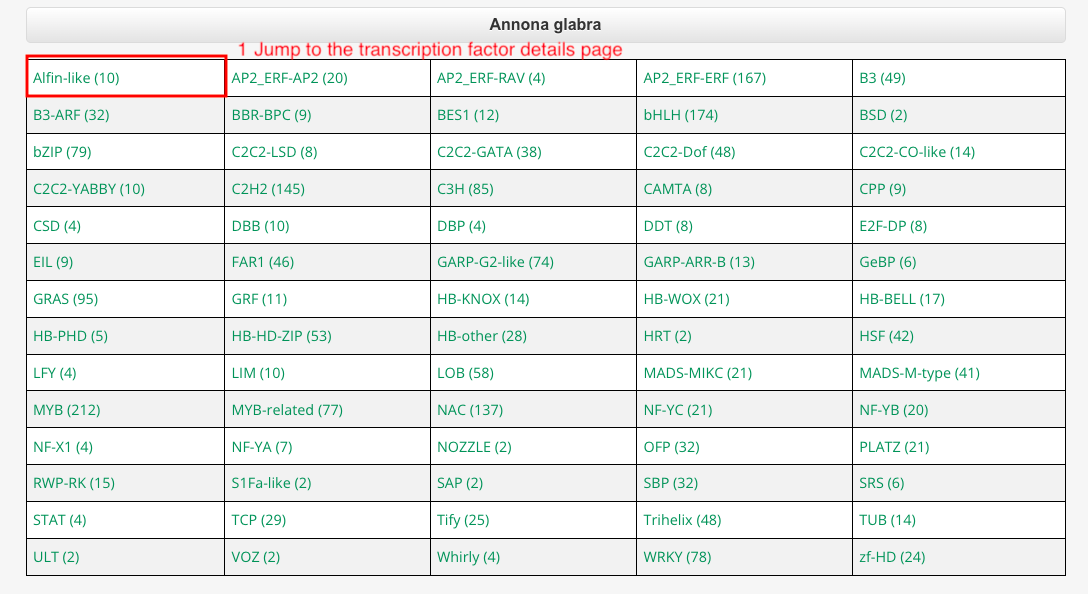
Part 2: Transcription factor details page
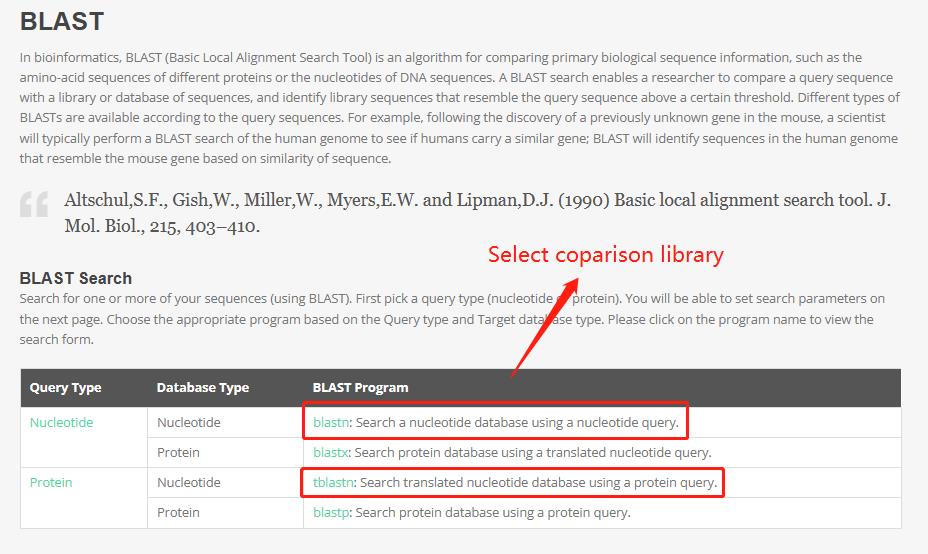
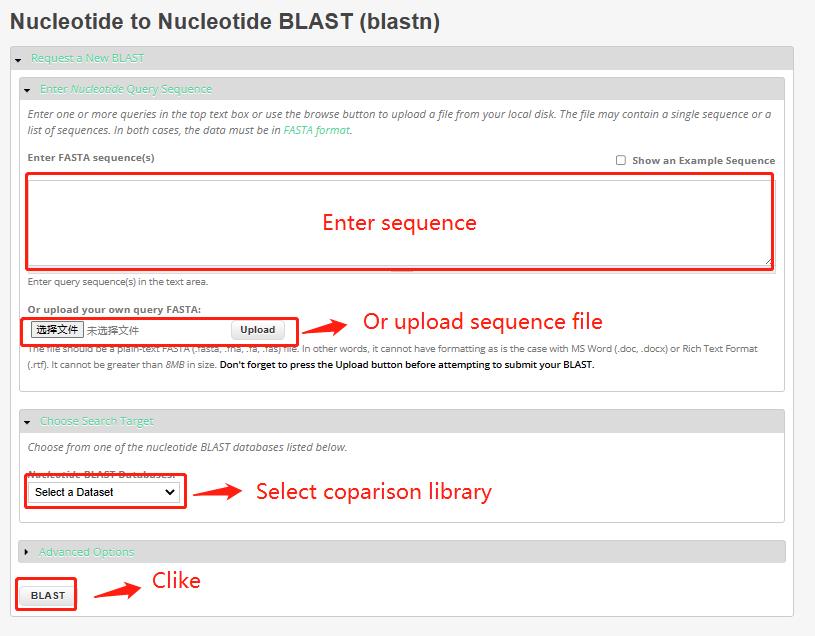
4 Blast
This tool provides Genome libraries for 23 species, and users can BLAST one to more of them.
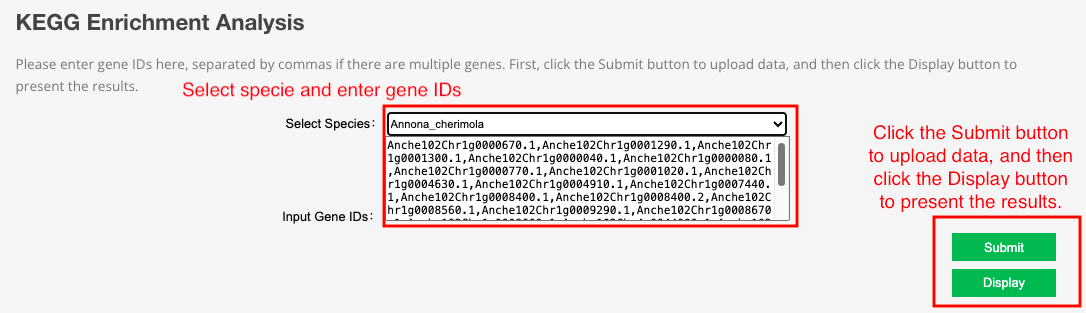
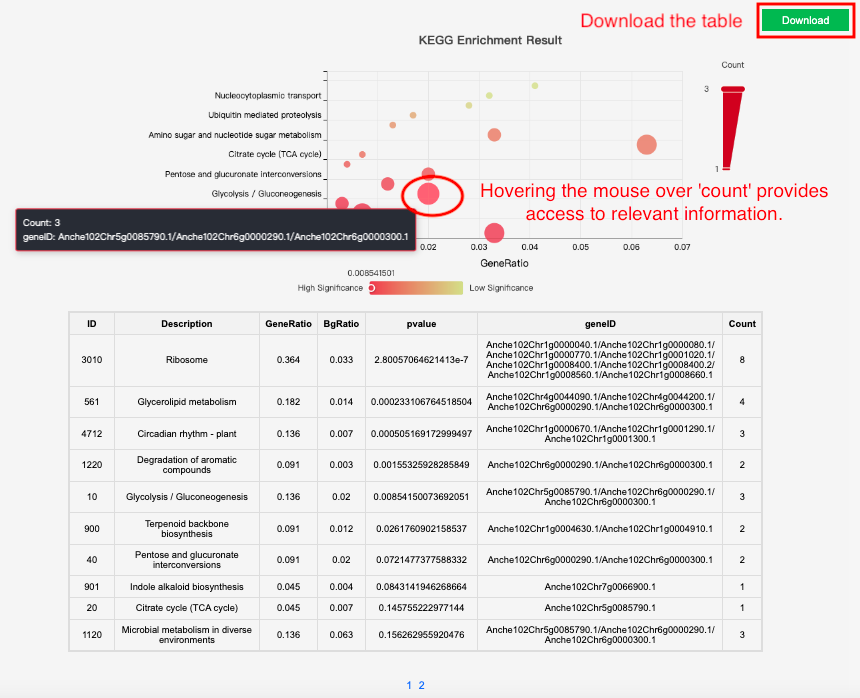
5 KEGG Enrichment
This tool integrates the KEGG database of 21 species. Users can input gene ID for KEGG enrichment analysis and get KEGG enrichment bubble picture.
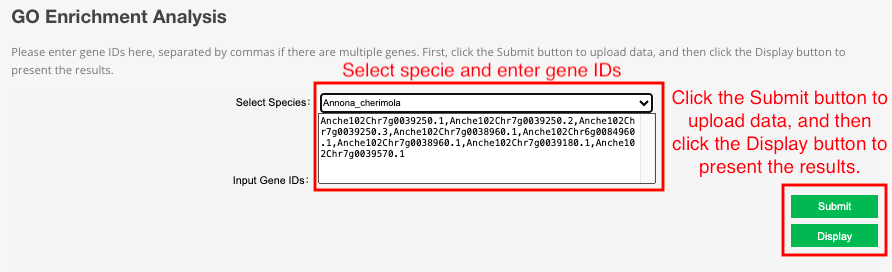
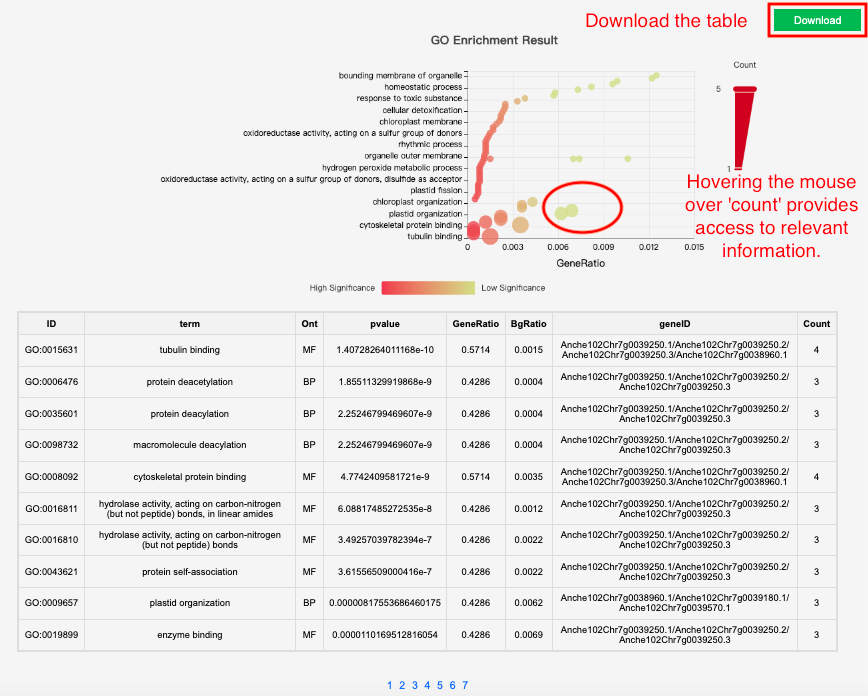
6 GO Enrichment
This tool integrates the GO database of 21 species. Users can input gene ID for GO enrichment analysis and get GO enrichment bubble picture.
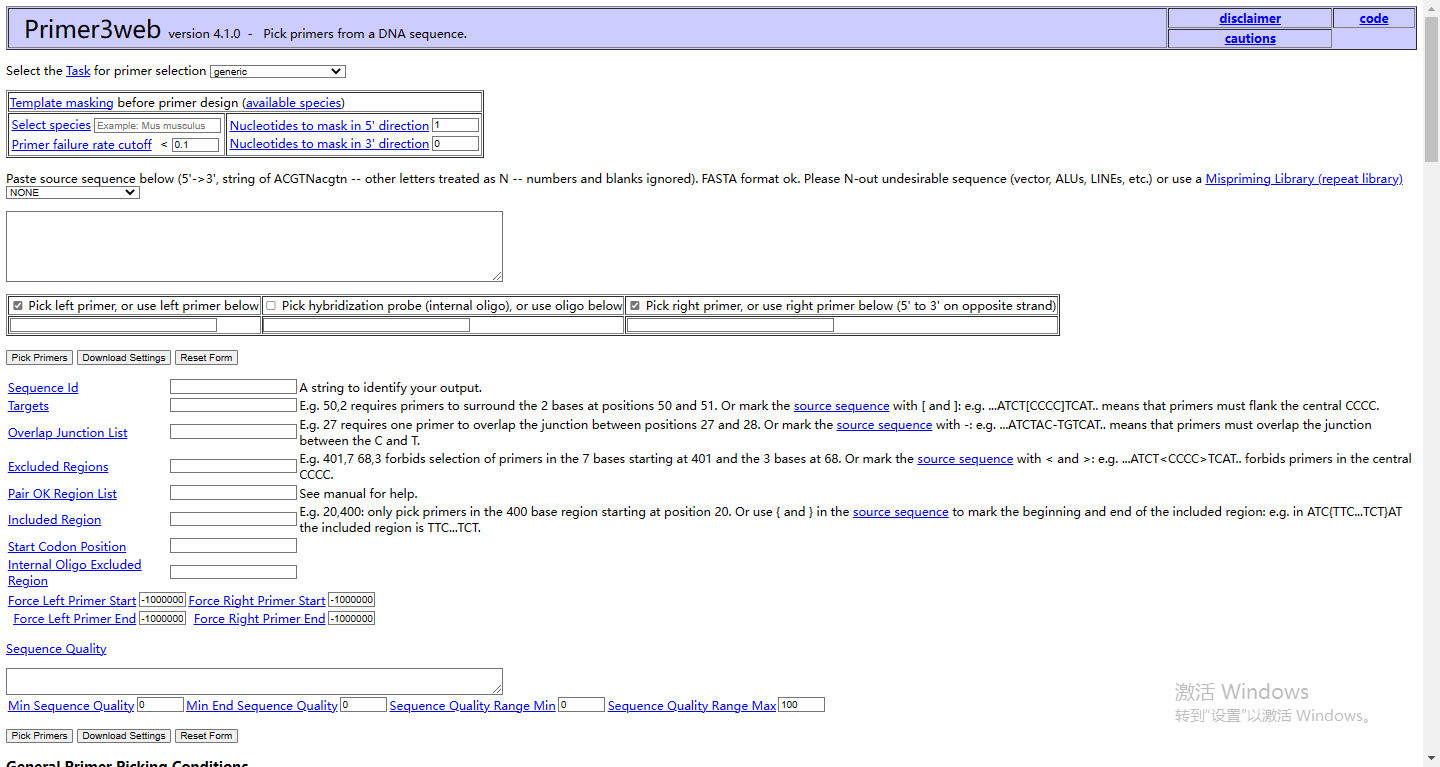
7 Primer 3 web
This tool provides primer design functionality, allowing users to design primers according to their specific needs.
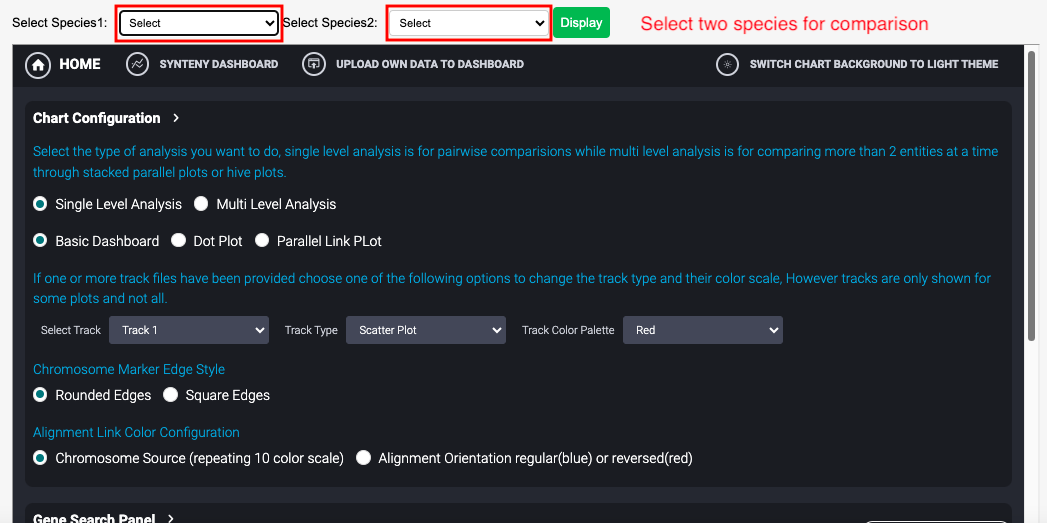
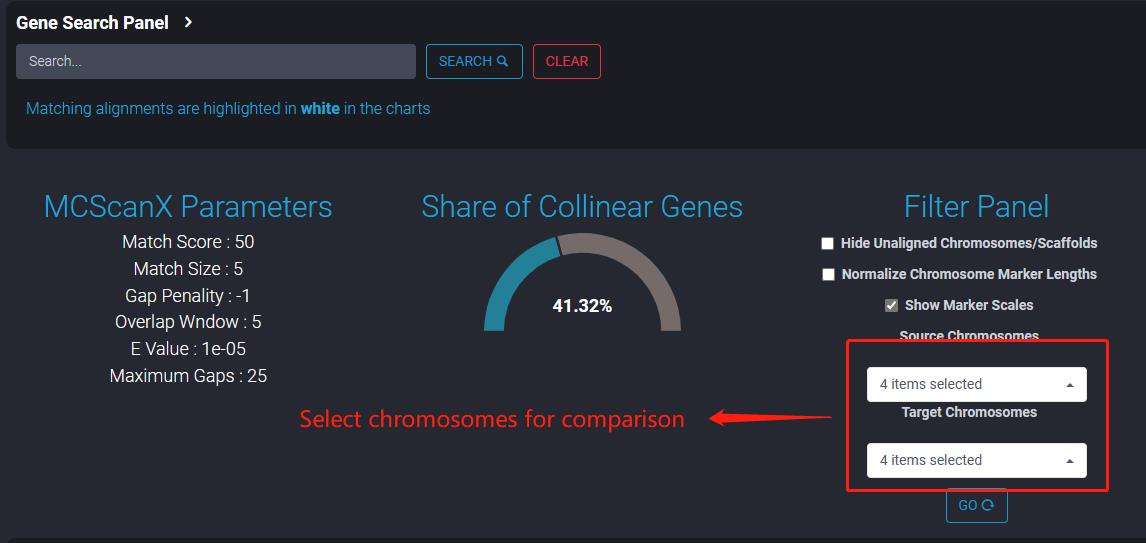
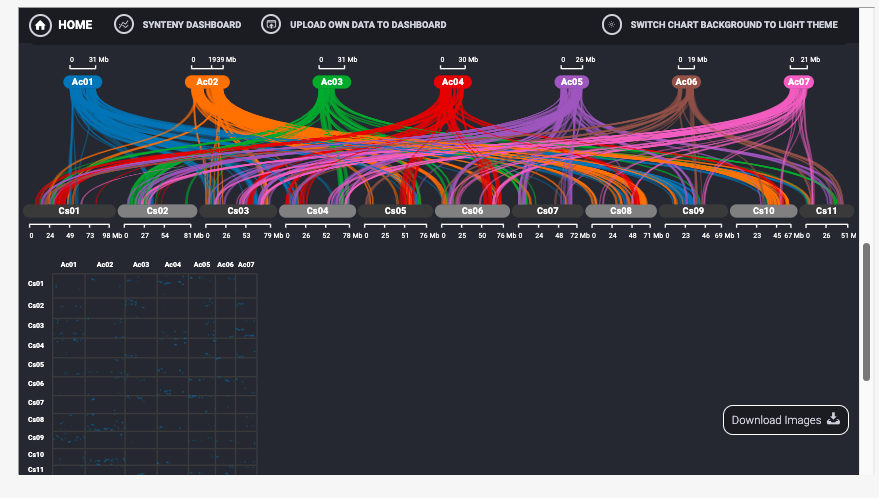
8 Genome Synteny
The tool offers different types of visualizations such as Linear Parallel plots, Hive plots, Stacked Parallel Plots and Dot plots. Users can configure the type of plots required and then choose the source and the target chromosomes that need to be mapped. Users also have option to download the generated visualizations in publication ready SVG or PNG formats.
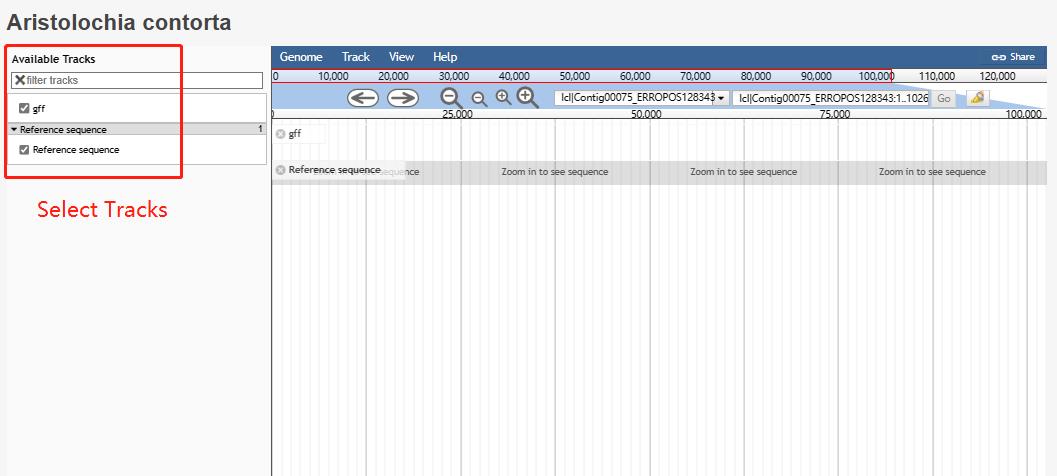
9 Jbrowse
This tool enables users to visualize gene features of 23 species.

10 Expression Heatmap
The tool offer users the functionality of gene expression level heatmaps.
Part 1: Users can directly click on "try an example" to obtain gene IDs.
Part 2: Users can select the species they are interested in, and the dropdown menu will automatically display the gene IDs of the selected species.
Part 3: After selecting the gene ID, clicking on "Display Expression Heatmap" will show the corresponding heat map.
Part 4: By clicking on the dropdown menu, users can select different bioprojects and sorting attributes, which will result in changes to the heat map. Users can also hover their mouse over the heat map to view specific information for each sample.
Part 5: Users can click on the download button to download the expression data of their selected gene in the chosen bioproject.
11 Gene Correlation
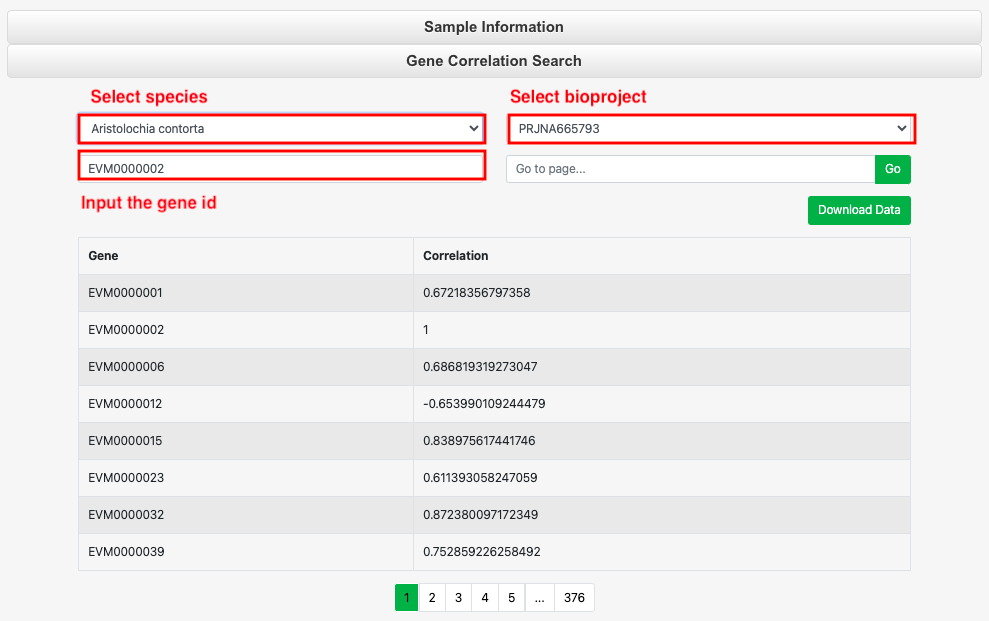
This tool is used to identify genes that are highly correlated with a target gene. It provides data for 14 species, allowing users to input a gene of interest into the search box to search for and download the IDs of highly correlated genes along with their correlation coefficients.
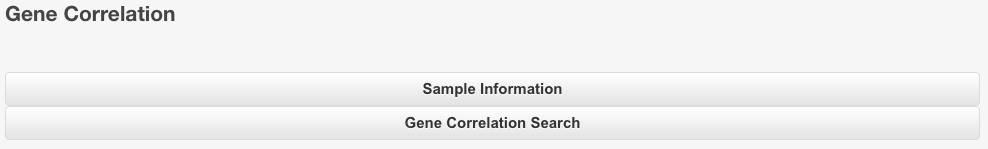
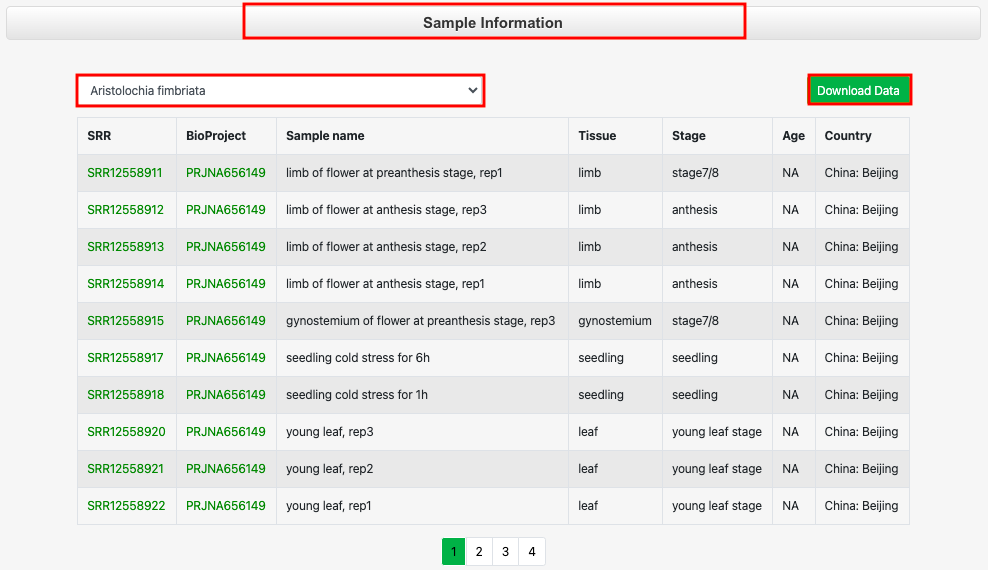
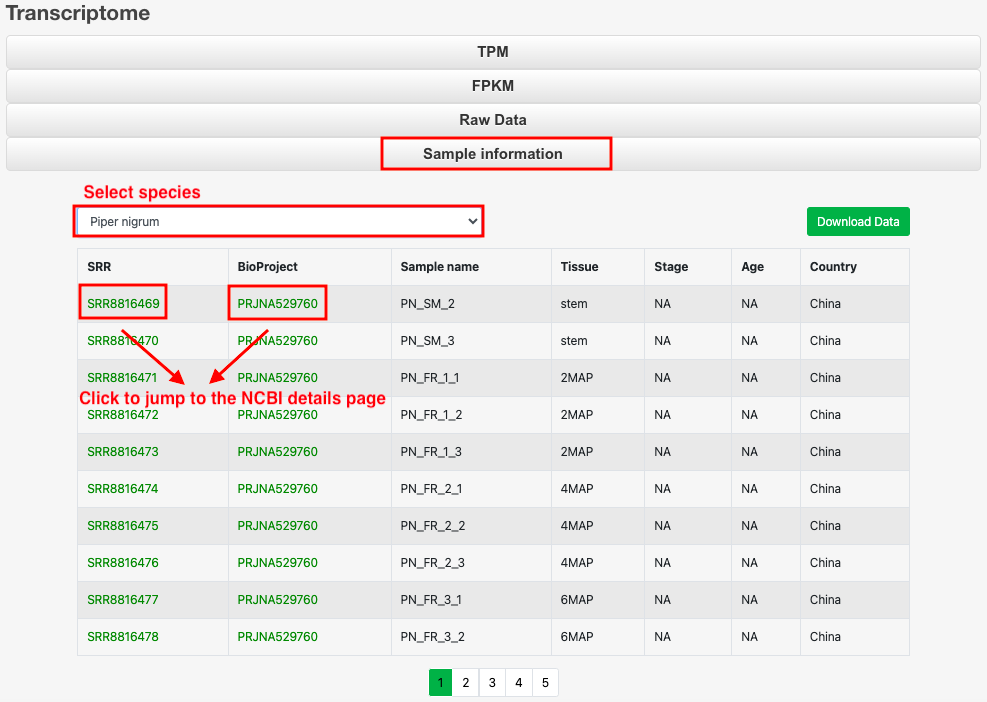
Part 1: Click 'Sample information' to select the species and view the related sample information, which can also be downloaded.
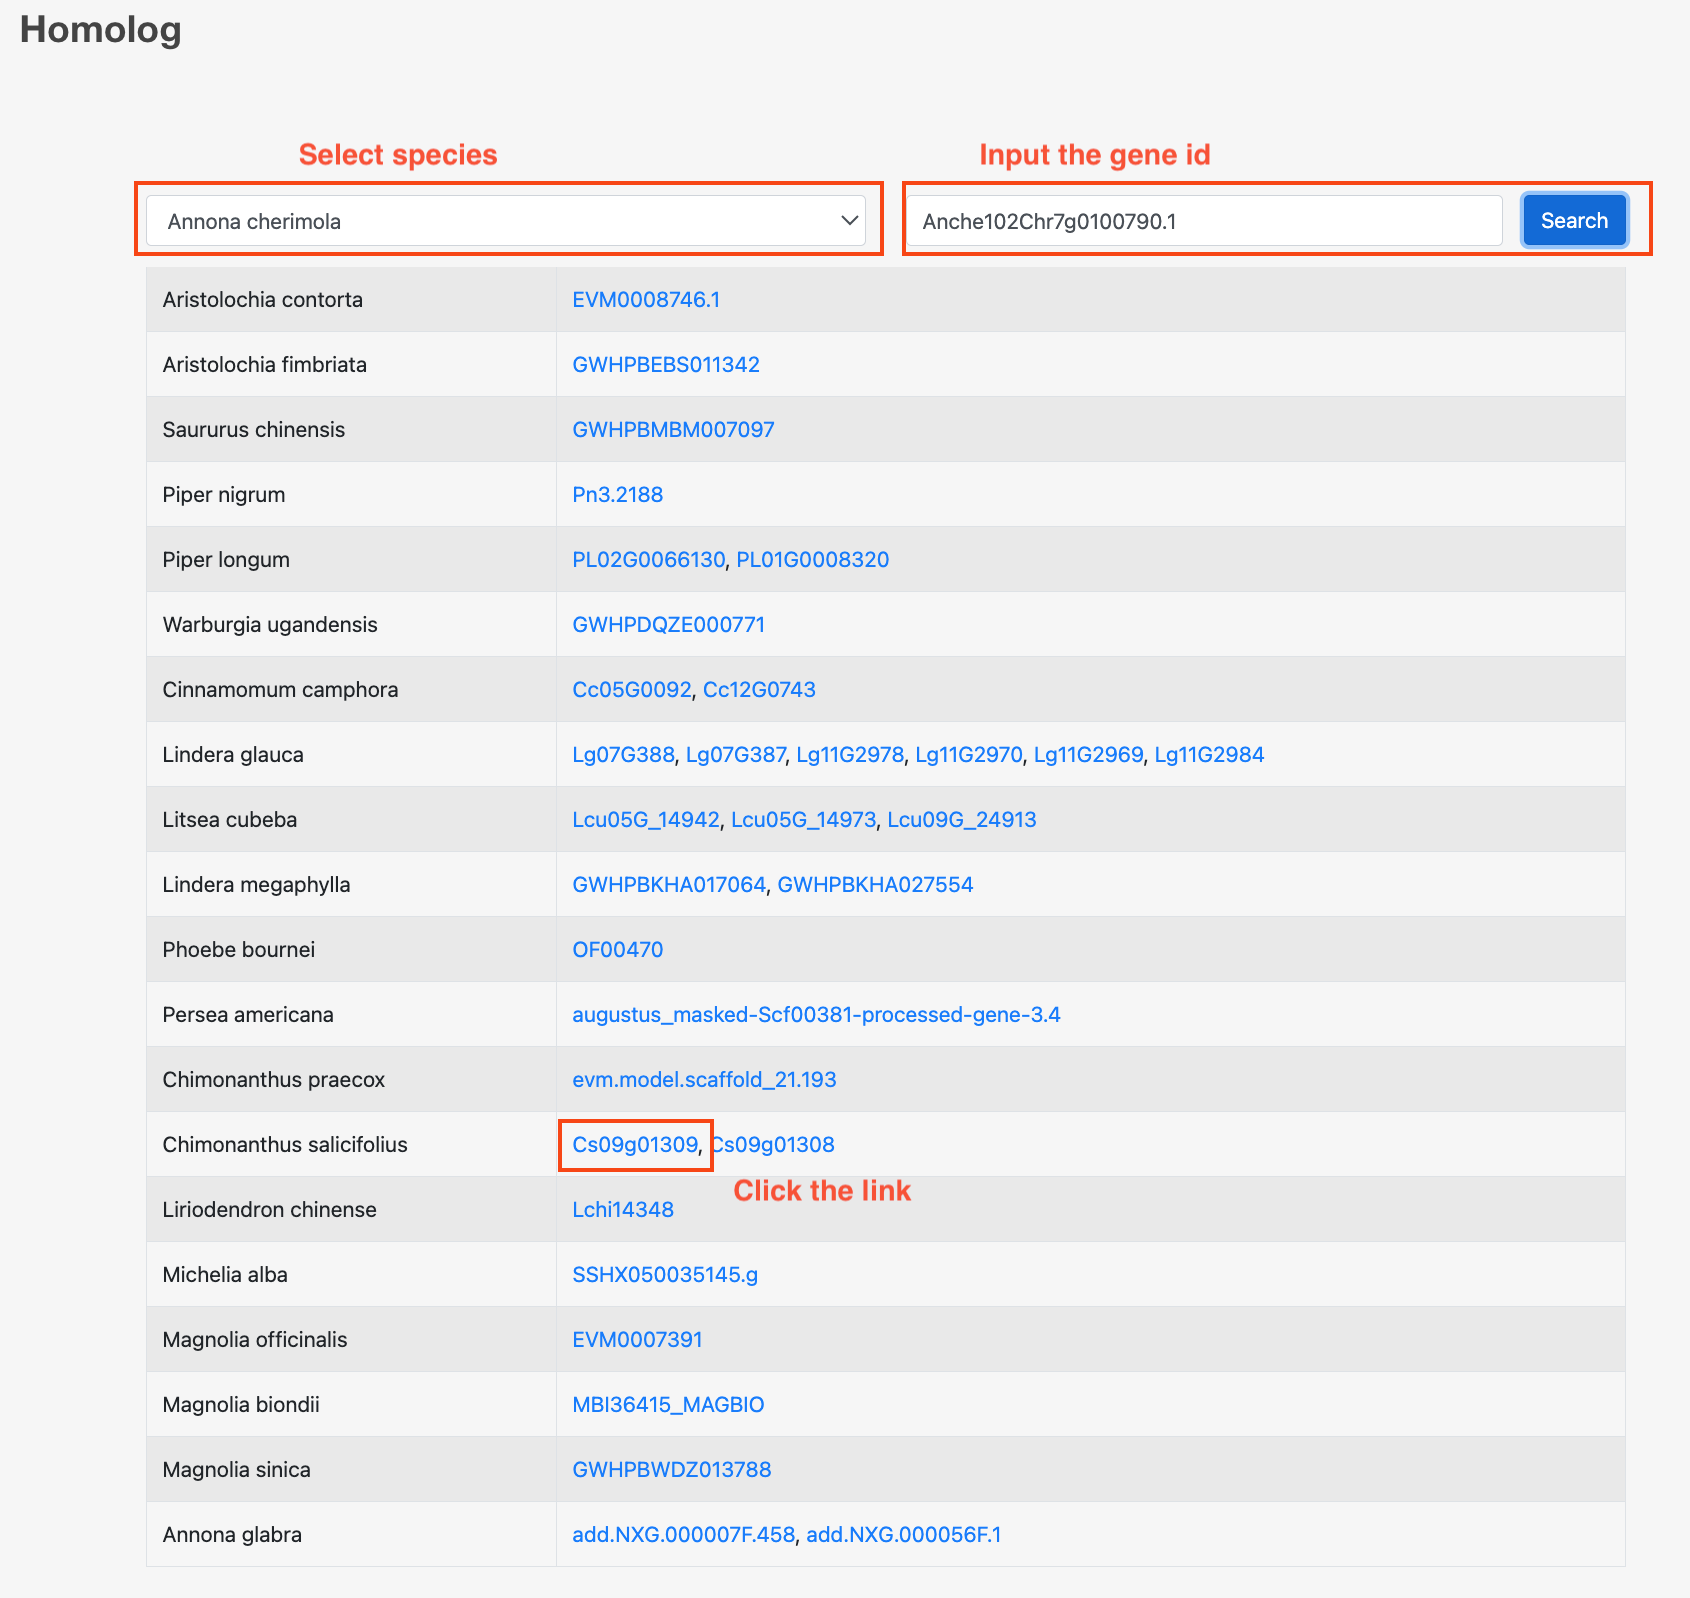
12 Homolog
Users can use this tool to search for orthologous genes of a specific species and gene. By clicking on the links to the orthologous genes, users can also access detailed information about the genes.
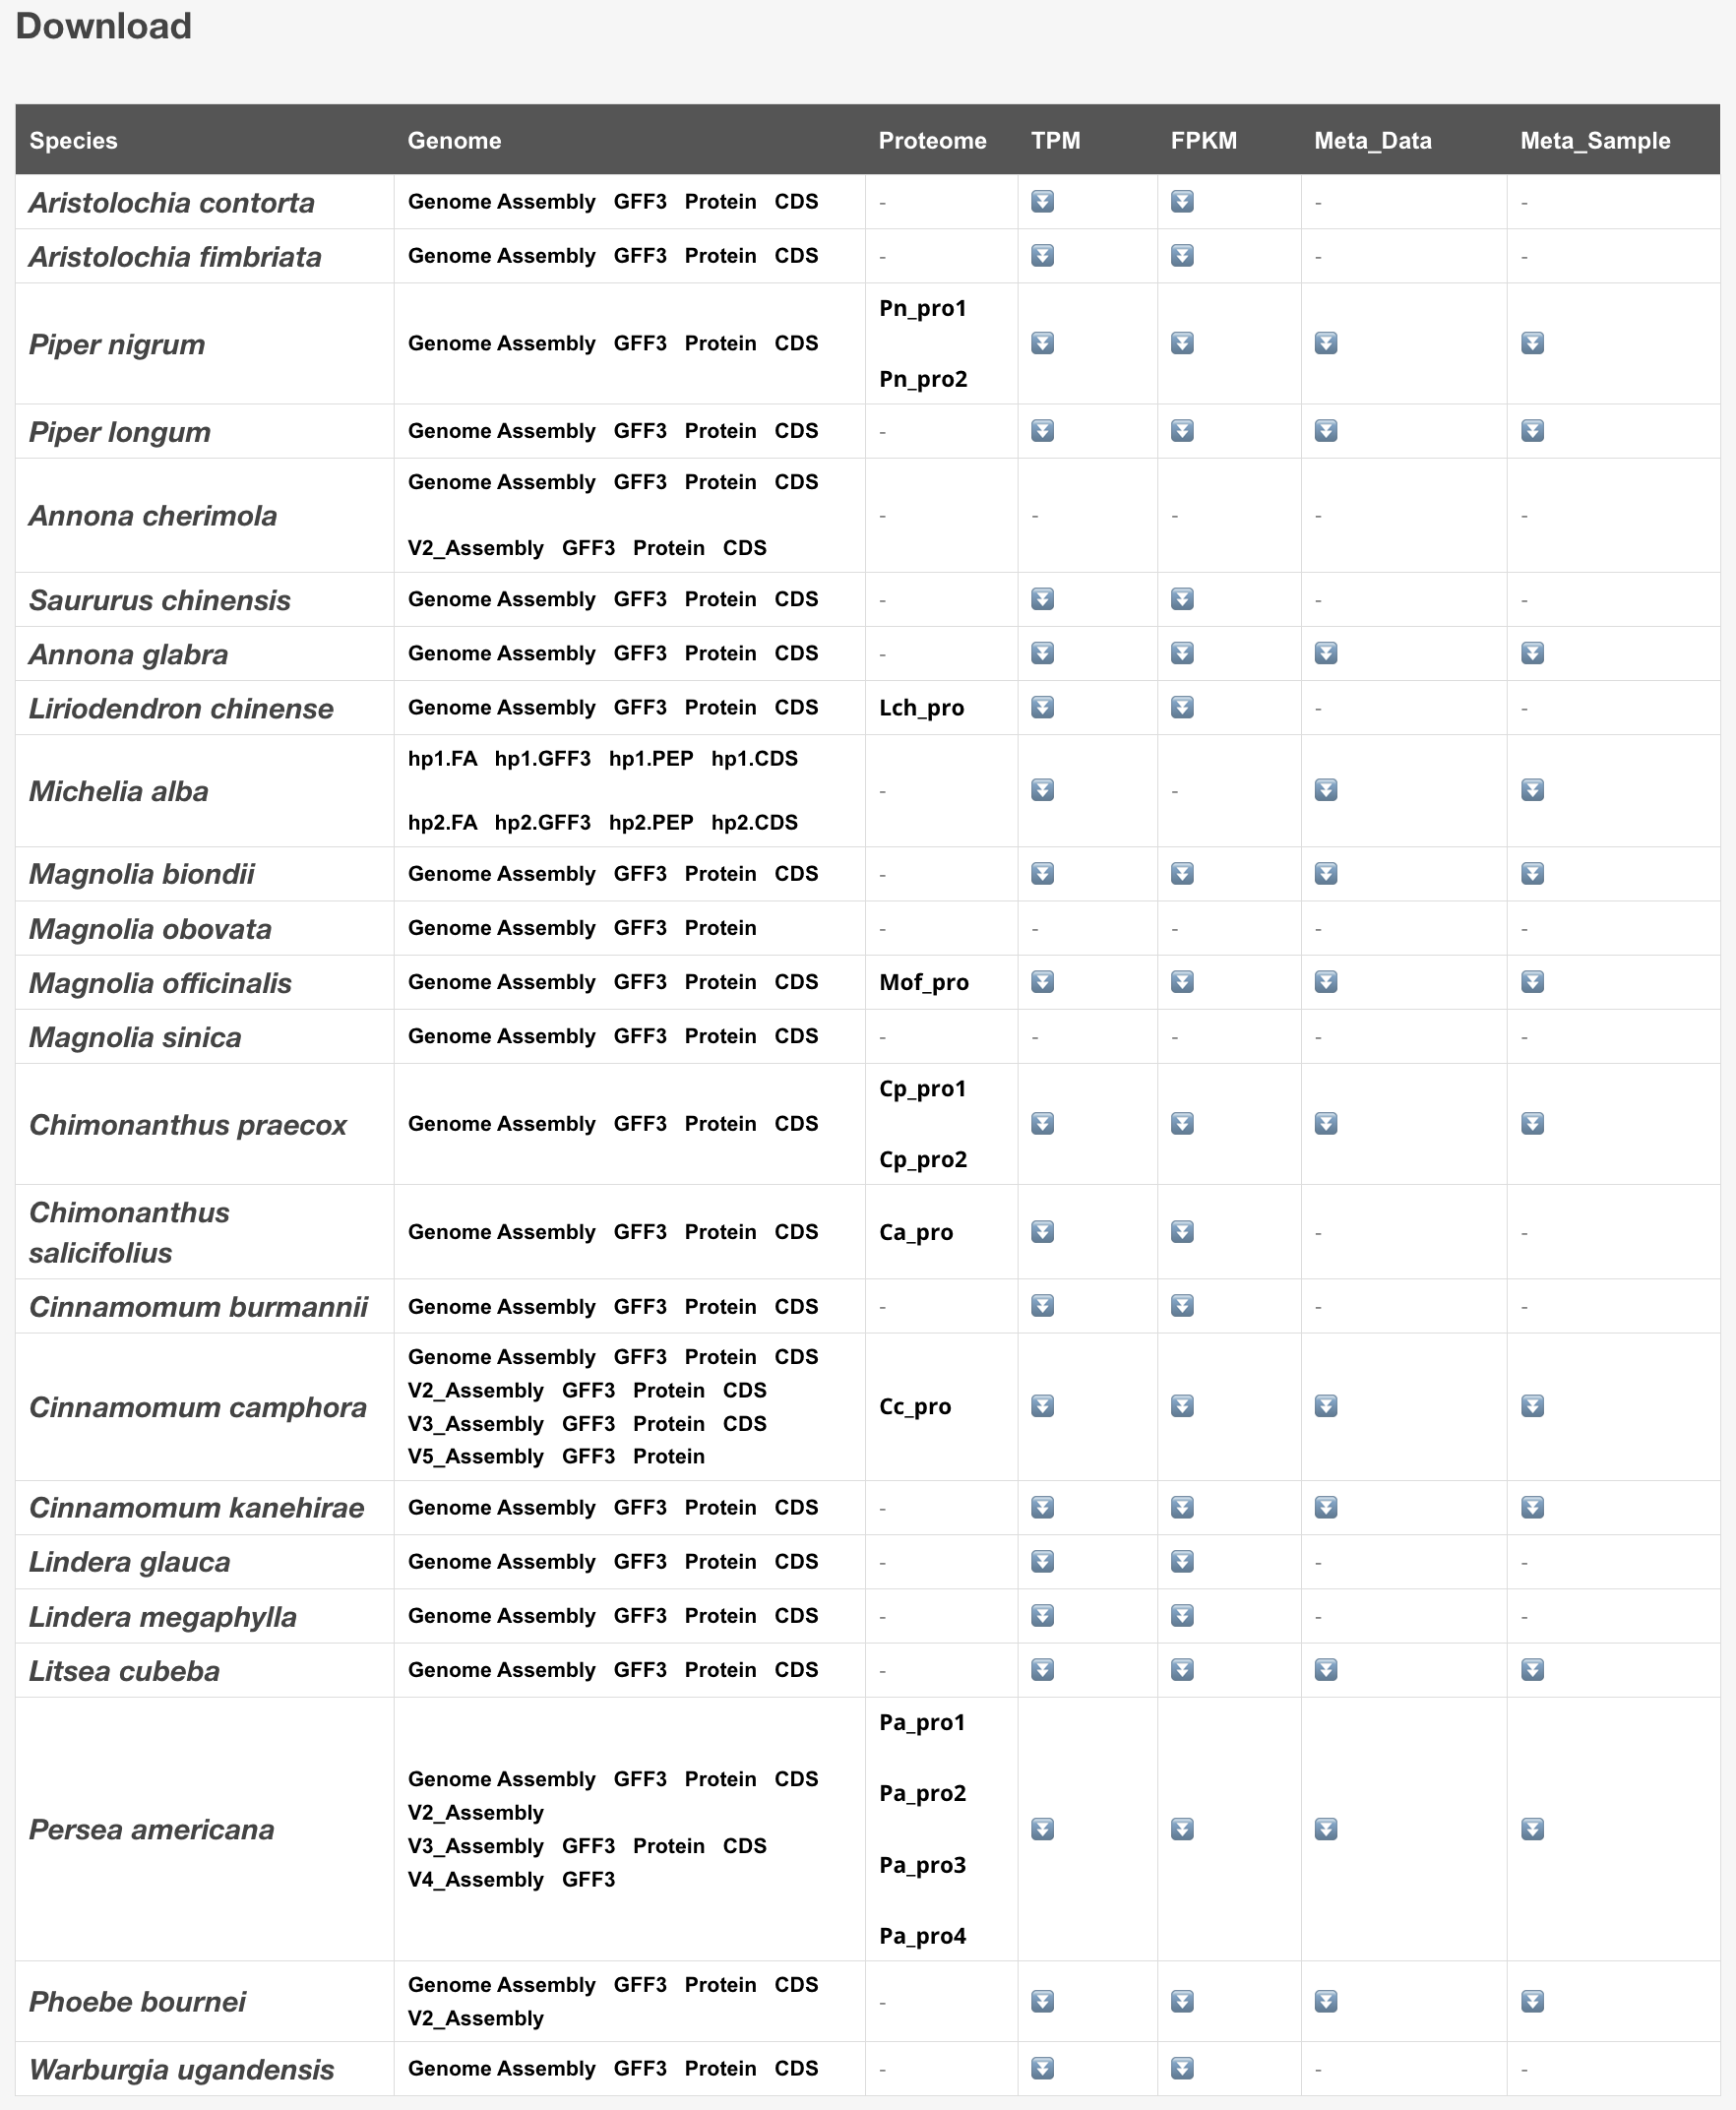
13 Download
Users can use this tool to download genome, transcriptome, proteome, and metabolome data.